Infrastructure
ClusterView: understanding Kubernetes through a live service map
A Kubernetes dashboard that connects service health, logs, dependency evidence, and optional AI diagnosis, with read-only defaults.
A failed Kubernetes workload rarely explains itself in one place. ClusterView brings the service, its dependencies, logs, and failure evidence into a single interface so an operator can follow the problem.
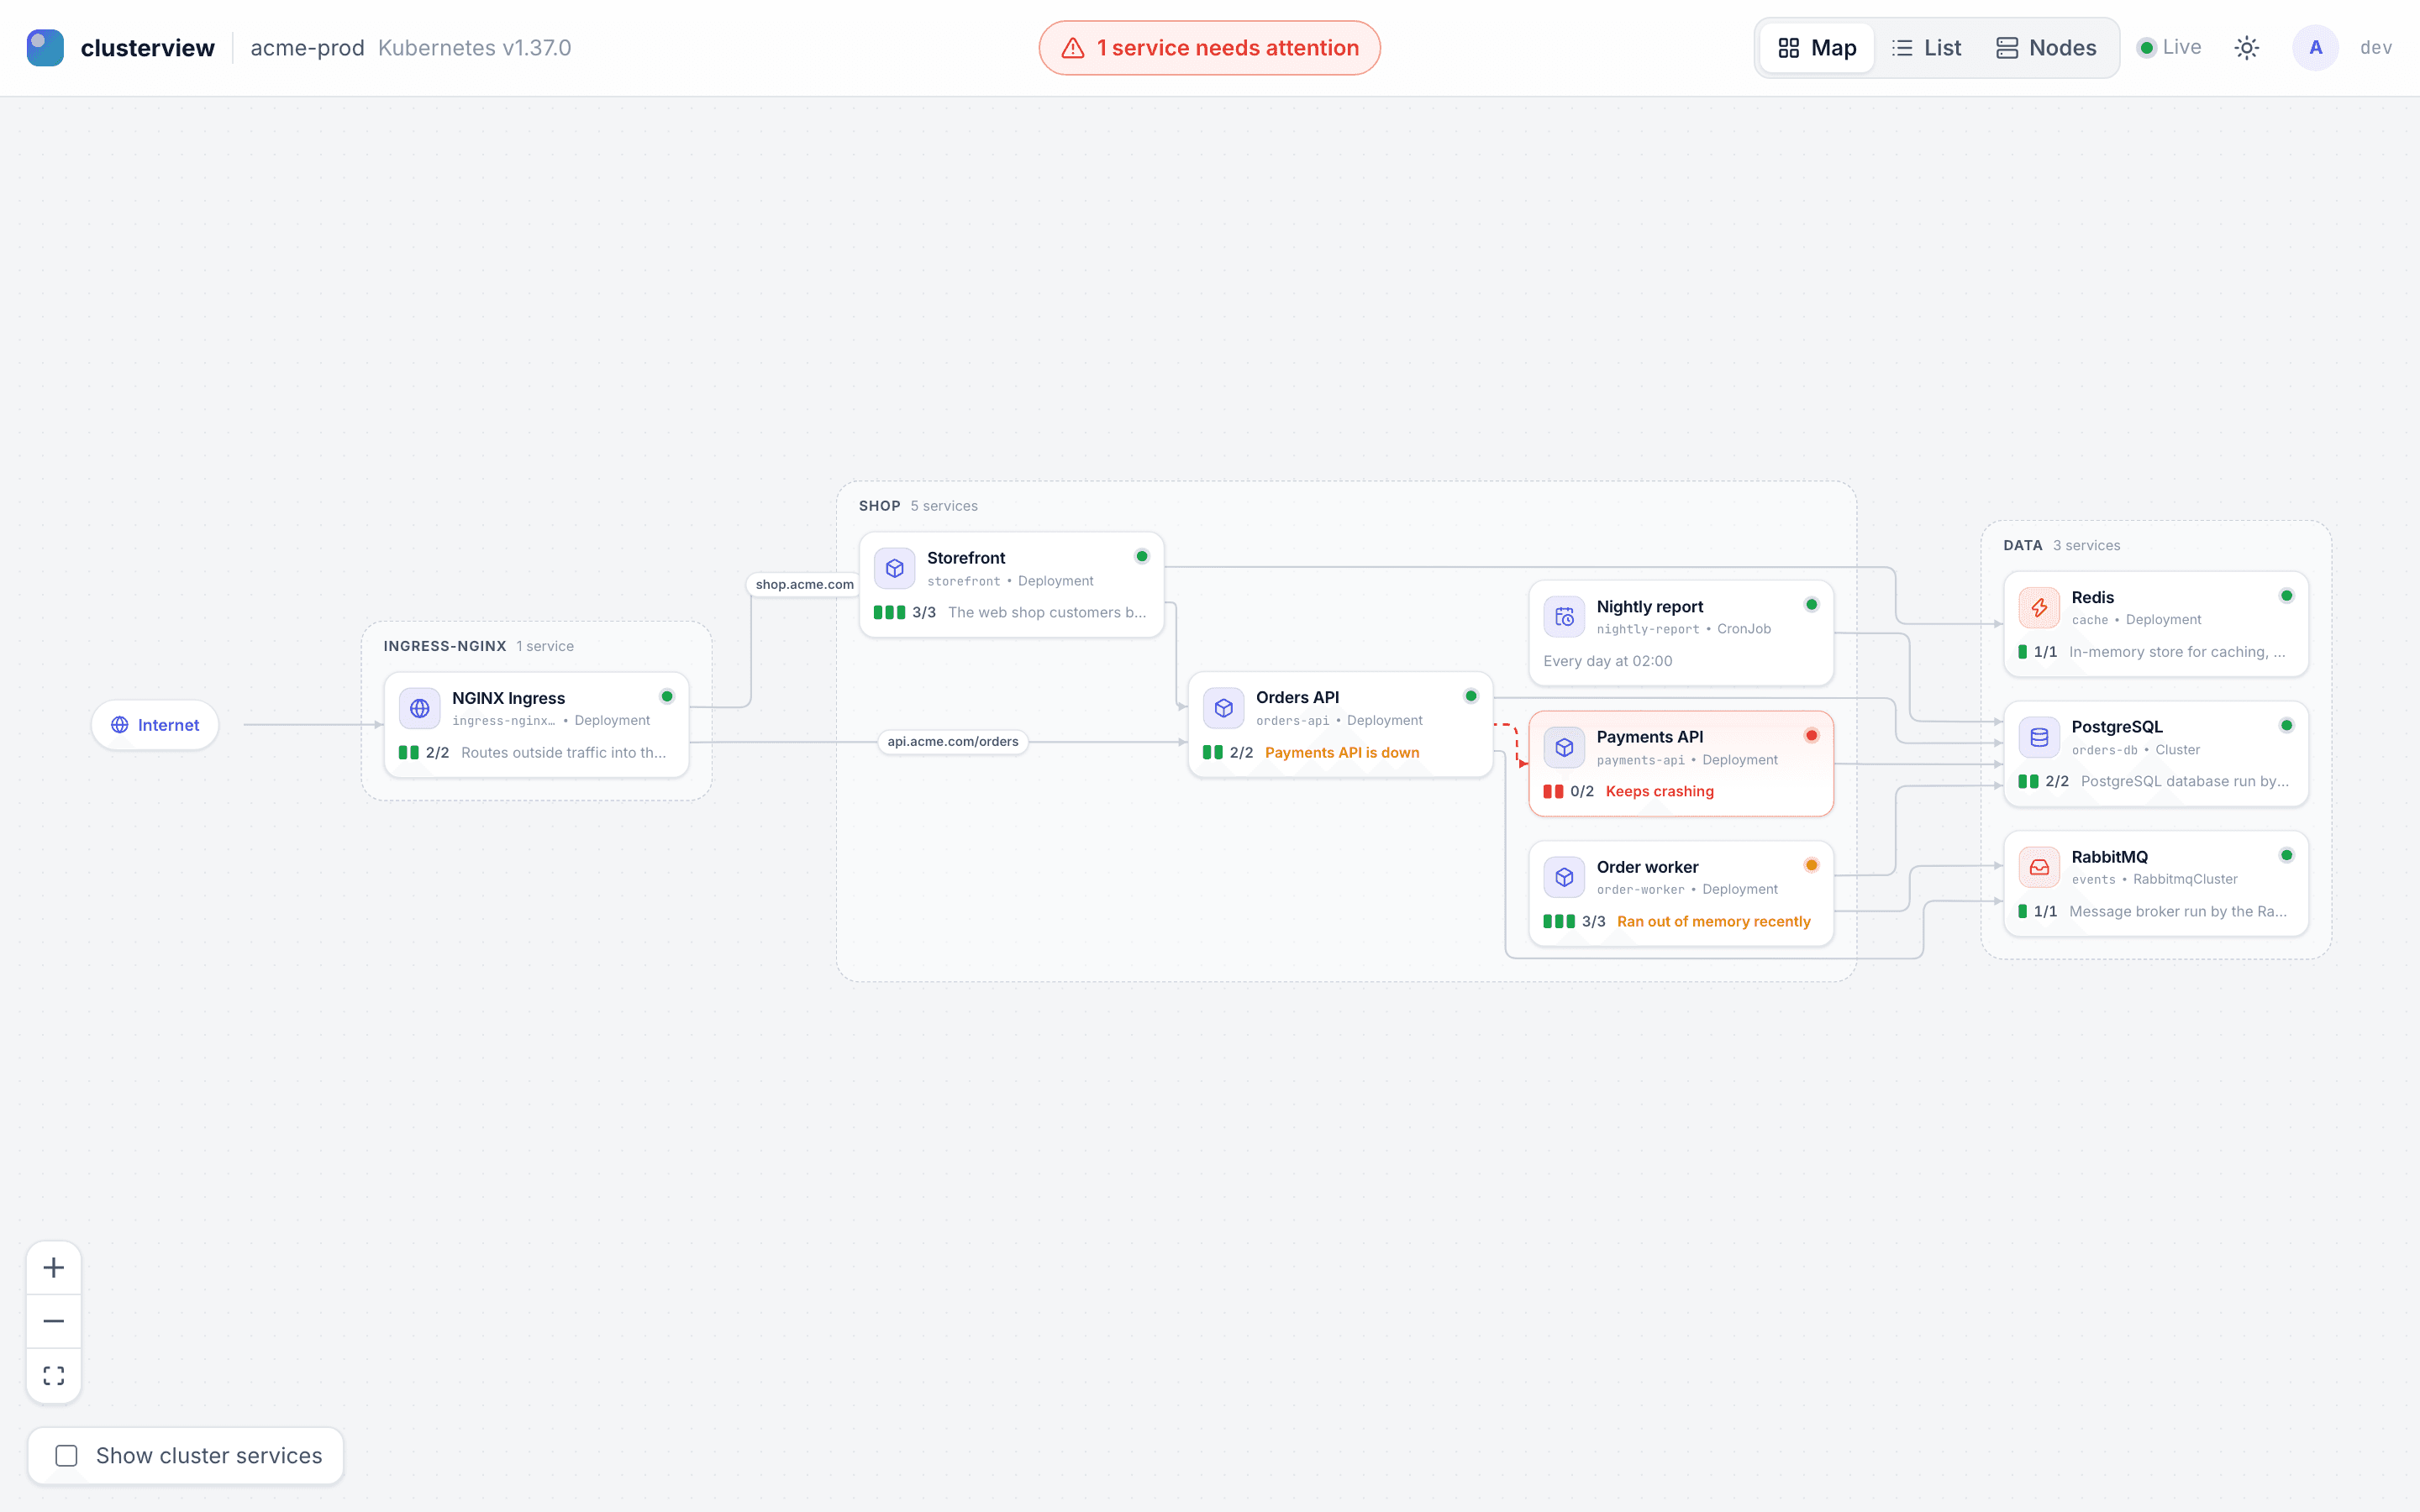
Start with the service that broke
The dashboard represents services as an explorable map. A failing service is highlighted, and selecting it opens details and logs. Search jumps to services, namespaces, or pods; list and node views offer other ways to inspect the cluster.
Connection focus shows direct callers and dependencies. Combined logs retain pod and container labels, which helps preserve the origin of an error while investigating several replicas.
A cluster tool with deliberate controls
A Go application and TypeScript web interface receive live cluster updates. Helm installation and a local kubectl plugin provide different ways to reach the dashboard. Optional AI diagnosis uses a configured provider to turn evidence into an explanation.
The default installation is read-only. Operational actions require explicit configuration and scoped permissions. The documented controls constrain operations such as restarts and scaling, and record attempted actions in an audit log.
Diagnosis still needs an operator
An explanation is useful when it points back to observable evidence. AI output still needs review against logs, events, and the actual workload configuration; it is not proof that a proposed command is correct.
Authentication, namespace access, and the choice to enable actions belong to the deployment configuration. The repository documents these choices instead of treating a dashboard installation as automatic authorization to change a cluster.
Follow a failure through the interface
The README includes real screenshots of the map, detail drawer, logs, and diagnosis view. The service-log guide explains aggregation limits and reconnect behavior. The image on this page is a project screenshot, rather than an interactive cluster.
Sources and further reading
Based on the linked project documentation, reviewed on 2 November 2026. Capabilities and limitations describe that documented version.
View repository